Welcome to my portfolio! My name is Quinton Mikula, and I am a Data Analyst
with expertise in SQL, Power BI, Python, and data visualization. I graduated from
the University of South Florida in 2021 with a Bachelor's of Science in Business
Administration, and I have since built a career focused on transforming raw data
into actionable insights that drive business decisions.
With nearly 3 years of professional experience as a Data Analyst, I have developed
reports, dashboards, and automated workflows that optimize operations, improve
profitability, and enhance strategic decision-making. My passion for problem-solving
and data-driven decision-making has led me to work on projects ranging from financial
reporting and forecasting to process automation and performance analysis.
I enjoy taking on challenges and continuously expanding my technical skills.
Whether it's writing complex SQL queries, developing interactive Power BI dashboards,
or automating data workflows, I am always eager to learn and refine my approach. My goal
is to uncover hidden patterns within data and present them in a way that makes an impact.
Feel free to explore my projects to see examples of my work. I am always open to new
opportunities and collaborations—let’s connect!


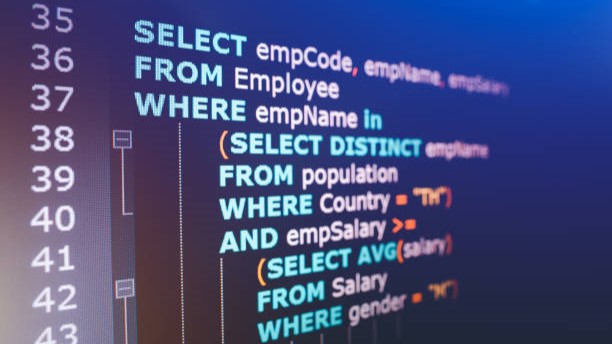
Just a sample of some SQL queries that I've built throughout my career thus far.

I built a model using Python that predicts soccer match score. You type in the home team and away team, and the model uses machine learning with historical match data to predict what the score will be.

In this project, I performed data cleaning, analysis, and dashboard creation on road accidents data using Excel. The resulting dashboard provided a comprehensive view of road accidents and enabled informed decision-making in traffic safety.

I conducted an in-depth analysis of Adidas sales data in the US using Excel. I utilized the insights gained from the analysis to assemble a user-friendly dashboard, that provided a clear overview of Adidas sales performance in the US market.

I conducted data cleaning and statistical analysis for a restaurant using Excel, focusing on understanding the revenues generated from different products per manager. These insights helped optimize product offerings and improve revenue generation strategies.

I utilized SQL to analyze data from a diner, addressing key questions for the business owner. By leveraging SQL's capabilities, I gained valuable insights into the diner's customer base, enabling the development of targeted promotional strategies.

I employed SQL to clean and prepare housing data for advanced analysis, including complex queries like CTE's to transform and structure the data effectively.

I explored a Covid-19 dataset using SQL to uncover valuable insights and patterns related to the pandemic. Leveraging SQL's querying capabilities, I analyzed various aspects such as infection, death and vaxed rates, allowing for a deeper understanding of the impact and dynamics of COVID-19.

I created an HR dashboard using Power BI, which involved using DAX functions and Power Query to process and visualize HR data. The resulting dashboard provided valuable insights and allowed for easy monitoring of key HR metrics.

I took data from a survey of data professionals, and created a simple and easy-to-understand dashboard using Power BI to share the insights.

I designed a sales dashboard using Tableau that involved creating calculated fields and parameters to analyze and present sales data. The resulting dashboard provided actionable insights into sales performance.

I cleaned, transformed, and manipulated client data using the Pandas library in Python in order to create a list for the call center. I employed for loops and various other functions to obtain a refined and structured dataset.

I developed a Python-based web scraper to monitor the sales price of a product on Amazon. The scraper regularly fetched the price data, stored it in a CSV file, and triggered an alert if the price dropped below a specified threshold.

I utilized Python to extract data from CoinMarketCap using their API in this project. Through the implementation of a for loop, I captured and documented price changes for various cryptocurrencies. Leveraging the extracted data, I created a compelling visualization to visualize the cryptocurrency market trends.


